Monday, October 25, 2010

Global Logistics Properties 30 mins chart Testing Critical Supports


Critical orange support and red dual uptrend support being tested on 30 mins chart. Support failure here will result in further declines. Conversely, a successful rebound will probably test previous resistances.

Potential Supports

1. Blue support band

2. Pink support area

3. Green all time low major support belt


Potential Resistances

1. Ichimoku Storm Cloud

2. Resistance band at 2.30 to 2.29

3. All time high peak resistance 2.33

Wednesday, September 29, 2010

Yanlord Testing Potential Reversal Zone


Yanlord is testing the red bold rectangle potential reversal zone. A successful rebound within this zone will probably propel price towards the blue upper channel resistance at around $1.80 and may retest the higher resistance of the red band at about $1.90

Support failure of the red rectangle zone will probably find new support at one of the potential dotted support lines as indicated on the chart.

Thursday, September 16, 2010

Genting Channel Within Channel


Resistances

1. Upper dual resistance band of blue minor channel

2. Upper dual resistance band of red major channel

3. Milestone $2.50


Supports

1. Natural psychological support $1.90

2. Orange support zone

3. Green support zone

4. Lower dual support band of blue minor channel

5. Gap Support Band $1.30 to $1.35

6. Lower dual support band of red major channel

Tuesday, September 14, 2010

Sinotel Testing Ichimoku Storm Cloud


Resistance Zones

1. Immediate Resistance Ichimoku Storm Cloud

2. Dual Green Downtrend Line

3. Red Resistance Band

4. Upper Blue Channel Resistance

5. Dotted Blue Resistance Band


Support Locations

1. Immediate Ichimolu Storm Cloud

2. Orange Support Zone

3. Lower Blue Channel Support

4. Late May Early June 2010 Congestion Region

5. 30 cent Milestone

Wednesday, September 1, 2010

Z-obee Testing Neckline Support Zone of Complex Head and Shoulders Formation


The high probability prediction of a multiple right shoulders formation was posted on 7 July 2010. This right multiple shoulders pattern has been confirmed and further weakness had plummet price towards the neckline support zone. The decline within the blue down trend channel is now testing the neckline support zone of the complex head and shoulders formation.

Upside Resistances

1. Immediate resistance of the upper boundary of the blue channel

2. 40 cents milestone

3. 43 to 41.5 cents resistance belt

4. Right multiple shoulders resistance band


Downside Supports

1. Immediate support of the lower boundary of the blue channel

2. Red neckline support

3. Mid June 2010 trough support at 32.5 cents

4. 30 cents milestone

5. Strong Green Support Zone

Tuesday, August 31, 2010

DJIA Testing Potential Diamond Trendline Support Zone


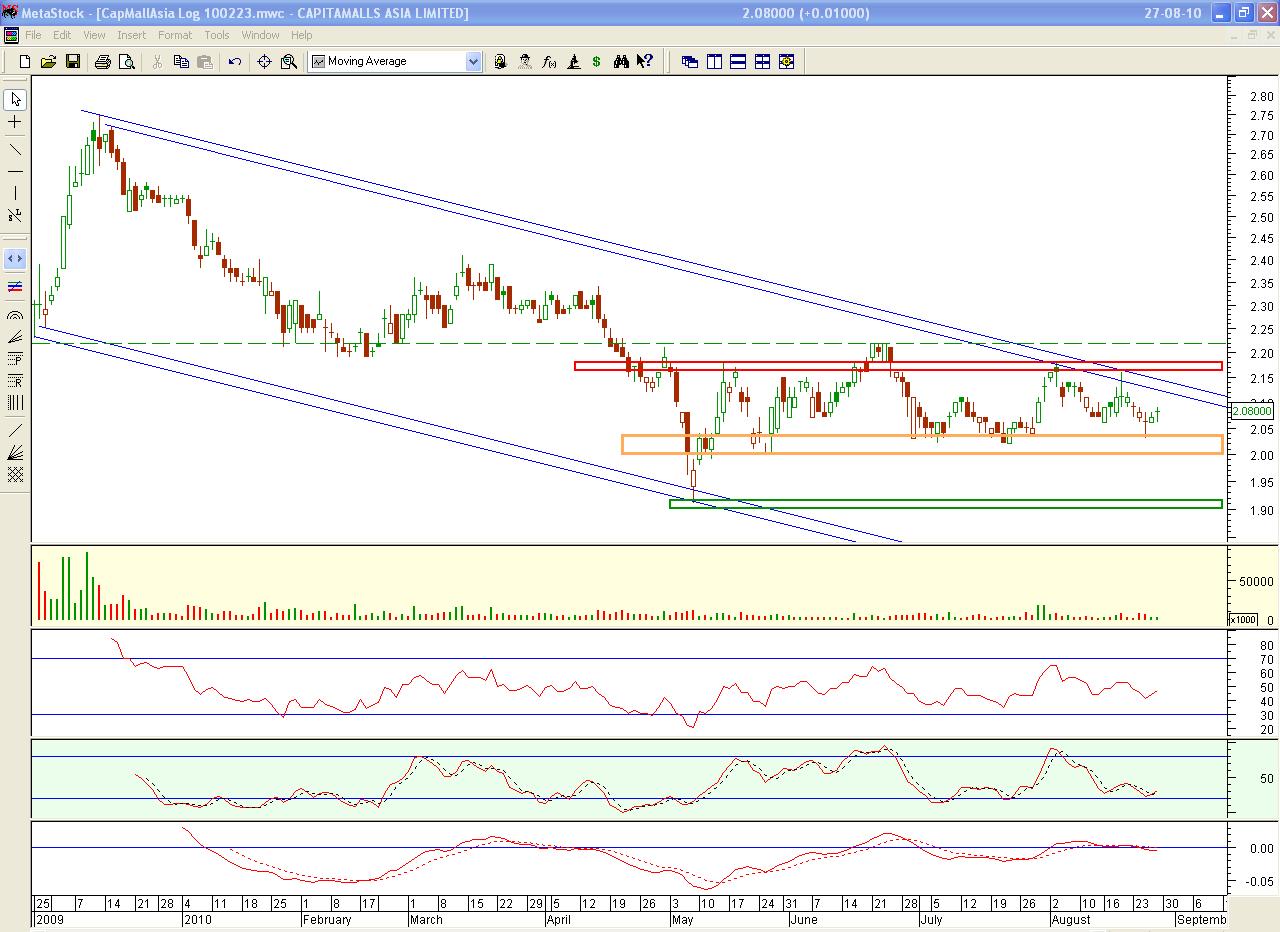
Choppy swings continue to plot the peaks and troughs of the giant diamond formation.

Upside Resistances

1. Upper resistance zone of green dotted channel

2. Green dashed down trendline of the diamond

3. Green bold down trendline of the diamond

4. Blue dotted resistance zone

5. Peak of diamond top


Downside Supports

1. Red dotted support zone of the red upper channel trendline

2. Lower support zone of green dotted channel

3. Orange dashed support belt

4. Red dashed median band of the red channel

5. Lower support of the red channel


Take note that any retest of the diamond top may result in a potential double top scenario. Further upward strength will confirm a continuation diamond pattern.

Conversely, if the lower support of the red channel fails a diamond top pattern will be confirmed and the index will probably plummet towards 8000. If weakness persists at this region a retest of the March 2009 low is imminent.

Sunday, August 29, 2010

Yanlord Gravestone Doji Double Inside Day Compression


The double inside day compression pattern denotes a potential breakout scenario. Take cue from the direction of the breakout. Upward breakout will result in a rebound from the immediate support of the dual upper boundaries of the blue channel and challenge the orange resistance zone. If the orange resistance zone is cleared the red bold dual resistance band will be tested.

Conversely, a downward breakout will demolish the immediate support of the upper boundaries of the blue channel and test the red dotted band support zone. If further weakness persists support will most probably be established at one of the following support zones:

1. Lower support boundaries of the blue channel

2. Green trendline support

3. Congestion rectangle 1.59 to 1.56 range support

4. Double bottom buffer zone

CapitaMalls Asia Upper Channel vs $2 Milestone Support


25 Aug 2010
Doji rebound from orange support zone

27 Aug 2010
Doji once again as indecision returns. A potential challenge to test the upper channel resistance is imminent with DJIA good closing figures on Friday.

Any breakout above this channel resistance will retest red resistance zone followed by green dashed resistance line. A strong breakout above the green dashed line will probably herald a change in trend from down to up.

Take note that the orange support zone is a major support that has been tested 4 times and a breakdown below this zone will retest the next support at the green zone.

Tuesday, August 17, 2010

Genting Channel Projections of Bowl Breakout Pattern


Bowl pattern breakout currently testing dual resistance of median zone of the red channel. Bowl breakout measured move target is around 1.80 but needs to punch through red channel median resistance zone. A successful breakout above red median zone will test blue channel dual upper resistance band.

Support zones for pullback may be found at the following locations

1. Lower dual support lines of blue channel

2. Red channel lower support

3. Green gap support zone

4. Mid marubozu support at 1.40

5. Light blue gap support area

Thursday, August 12, 2010

DJIA Potential Head and Shoulders Clone Within Potential Diamond


Pattern within pattern fornation being created by the DJIA. Immediate support is the pink dotted support zone. A rebound from this pink zone will probably be halted by the blue descending resistance joining the peaks of the diamond top head and the peak of the right shoulder of the potential head and shoulders clone. In the event of an unexpected breakout above this descending resistance the upthrust will encounter next resistance at the light blue dotted zone. If further advance continues a retest of the diamond top head peak may result in a potential double top pattern.

Conversely, further weakness below the pink dotted support zone may find support at the green dotted support zone. A breakdown below this zone will confirm the potential clone head and shoulders pattern and the potential diamond top formation.

Wednesday, July 28, 2010

Noble Doji Indecision Near Critical Support


Since top reversal on 18 Mar 2010, the major trend is down. Currently trying to bottom and turn upwards but with massive indecision and strong downward pressure.

Critical green dash support zone must hold for any chance of a rebound. Any upward move will probably be challenged by the following resistances

1. Red dual resistance zone of the upper channel

2. Bold blue 200 EMA

3. Ichimoku Kumo Storm Cloud

4. Bold green 200 SMA

Conversely any breakdown below the green dash critical support may find new support at one of the following

1. Red dual support zone of the lower channel

2. Blue down trendline

Tuesday, July 27, 2010

Capitamalls Asia $2 Milestone Support


Since topping at the all time high peak at $2.75 price has been trapped inside a downward channel. Any breakdown below $2.00 will probably see a retest of the 1.95 to 1.90 support zone.

The downward dual resistance upper channel must be overcome if price wants to move higher. First peak resistance to clear is $2.11 followed by $2.22 before an uptrend turning is established.

Thursday, July 15, 2010

DJIA Enters Potential Resistance Zone


Doji halted advance inside potential resistance zone demarcated by green dotted and green bold diamond resistance lines. Any surprise upthrust above this green resistance zone will probably encounter strong bear defences at the light blue dotted resistance band.

A pullback towards the red support of the diamond is expected if the diamond trading pattern script continues to play accordingly. Take note of any breach of the orange dotted support area as this may be the start of a long term downtrend.

Wednesday, July 7, 2010

Z-obee Potential Complex Head and Shoulders Formation


The complex head and shoulders pattern took about half a year to form and is still a work in progress. A breakout above the 41.5 to 41 cents immediate resistance band will probably see the creation of a multiple right shoulders pattern similar to the one on the left of the head. The blue dotted resistance zone will probably halt any advance above 41.5 cents.


Any weakness that drops below the 39 cents immediate support will find the next support region at 37 to 35 cents. If further weakness persists and if the red neckline breaks strong support is expected at the green support area.

Metastock Equis - Stochastic Osc - Expert System Exploration List as at 6 July 2010


This Exploration uses classical interpretations of a slow stochastic to generate a list of securities that meet either buy or sell conditions.

A buy signal is indicated by a 1 in the first column of the Exploration report. A sell signal is indicated by a 1 in the second column.

Free trial for Metastock is available at www.metastock.com/tacttrial

Monday, July 5, 2010

DJIA Critical Diamond Support Being Tested


Hammer followed by hammer clone testing red diamond support. Closing below the red support indicates potential for further weakness. The hammer and its clone seems to suggest a probable rebound may happen. If no confirmation candlestick bar appears this week to support a rebound a drop into the lavender channel will probably take place. A drop into this channel will confirm the diamond top pattern and will result in further weakness.


Take note that if a hammer confirmation formation appears any upward move will probably be challenged by the green dashed diamond resistance line followed by the green bold resistance line. A successful breakout above these green resistances is highly remote. Any miraculous breakout here will result in a diamond continuation pattern and more upward swing is expected.

Friday, June 25, 2010

SGX Stocks Hovering Near 200 Days Simple Moving Average


The 200 SMA is used to demarcate bull zone from bear territory. Statistics have indicated that long positions above this line favours the bulls and short positions below this line provide better odds for the bears.

You should add this moving averages to all of your charts in all time frames. Yes. weekly charts, daily charts, and intraday (5 min,30 min, 60 min) charts.

The 200 SMA is the most important moving average to have on a stock chart. You will be astonished at the frequency a stock will reverse in this region.

When writing scans for stocks, you can use this as an additional filter to find potential long setups that are above this line and potential short setups that are below this line.

The list of SGX Counters Hovering Near 200 SMA was an exploration result written by using Metastock . Stay alert and be nimble if the counter you are trading appears on the list posted above. Expect high volatile swings as the stock struggles to decide whether to remain as a bull or tranform into a bear and vice versa.

Metastock free trial available at www.metastock.com/tacttrial

Wednesday, June 16, 2010

Sinotel Testing Gap Resistance


Testing of light blue gap resistance in progress. A successful breakout above this gap resistance will challenge the following potential resistances

1. Green upper channel resistance boundary
2. Pink resistance belt
3. Ichimoku Kumo Storm Cloud
4. Upper red channel dual resistance zone


Any pullback will probably retest the following support zones

1. Green support band
2. Lower green channel support
3. Milestone at 30
4. Lower red channel dual support zone

Stay alert and be nimble as market continues to roller coaster.

Tuesday, June 15, 2010

DJIA Line Chart Half Diamond To Full Gem


The orange half diamond formation mentioned in the 6 June 2010 posting has been transformed into a sparkling gem . A breakout upwards will confirm a reversal diamond pattern. The upthrust will challenge the formidable moving average ribbon bands and will probably be halted by the red trendline.

Conversely, a breakdown below the orange diamomd support confirms a continuation pattern and will probably result in more downward declines. A drop below the blue trendline will test the lavender and the green horizontal support levels.

Genting Approaches Double Bottom Measured Move Target Projection


After clearing above 1.07, the light blue immediate resistance is the next band to overcome. This band marks the projected target for the double bottom breakout confirmation based on the difference between the pink support and the 97.5 milestone. A strong breakout above the immediate resistance band will probably test the green resistance zone followed by the orange resistance region.

Take note that any pullback from the red upper channel dual resistance lines will retest the lavender immediate support area. Further weakness may find support at $1 .

Sunday, June 13, 2010

Equis Metastock MACD Scan List as at 11 June 2010


The Equis - MACD - Expert System is available as a trading system in Metastock. This exploration scan shows MACD Buy/Sell signals (MACD crossing above/below its 9-period EMA) with a 1 in either Column A or Column B.

Additionally, it finds stocks that reflect the MACD being in an overbought or oversold condition, which is reflected in Columns C and D.

The list posted above has been sorted by top volume. More info about Metastock available at www.metastock.com/tact

Free trial for Metastock 11 available at www.metastock.com/tacttrial

Friday, June 11, 2010

DJIA Range Bound Between 200 MA and Diamond Support


As expected DJIA is trapped between the red support of the potential diamond pattern and the dual resistances of both the 200EMA and 200SMA. A strong upthrust above these 200 moving averages will most probably be halted by the green resistance of the potential diamond formation.

The red support will probably be tested again if more shocking news are released. The diamond will be negated if there is no clear breakout by the time the index reaches the apex which is tentatively around mid Oct 2010.

Healthway Doji Pondering Entry Into Bear Zone


Doji contemplates invasion of bear territories. Blue bear standing guard at the bold blue immediate resistance border. A bull raid above this boundary will meet strong bear defences at the red upper channel dual resistance lines.

Immediate support is 17.5 to 17 followed by 16 to 15.5 support zone. Next bull support is the 14 support line. Strong bull support is at the red lower channel dual support lines.

Thursday, June 10, 2010

China XLX Testing Downtrend Resistance Slope


4th attempt at breaking upwards from the bold red dashed downtrend resistance slope in progress. The red down arrows indicates previous failed breakout attempts. A successful breakout must clear the mmediate light blue resistance band and will probably meet the following resistances

1. Bold green dual downtrend slope

2. Ichimuko Kumo Cloud

3. Orange resistance zone

Immediate support is the lower blue channel support followed by the pink support belt. A breakdown below 47.5 will probably retest the green support area. Support failure here will resume drop along the lower red channel support.

Sunday, June 6, 2010

DJIA Line Chart Diamonds and Half Diamond


The simple line chart is treated as the poor cousin of the more exotic candlesticks charts and is often overlooked. In character, in manner, in style, in all things, the supreme excellence is simplicity. Using the simple line chart the green and red diamonds can be seen clearly. The orange half diamond is also known by many names such as

1. Reverse Symmetrical Triangle

2. Megaphone

3. Broadening Pattern

Depending on how the market moves next week this orange half diamond may developed into a full diamond if high volatility swings become compressed.

Take note that a head and shoulders pattern with a red diamond top head was confirmed when the red bold trendline which is also the neckline support broke down on 20 May 2010. This coming week will be critical because support failure of the bold blue trendline will probably result in a fall towards the green horizontal support which is also near the measured move projection of the head and shoulders formation.

A technical rebound is expected for the orange half diamond but it will probably be halted at the light blue horizontal resistance line. Until a powerful breakout emerges from this orange half diamond pattern more range trading between the light blue and pink horizontal lines will be the norm.

Wednesday, June 2, 2010

Z-obee Falling Towards Major Support Confluence Zone


Breakdown from the green inverted cup and handle target support band has resulted in a drop towards the major support confluence zone comprising of

1. 200 EMA

2. Light blue support region

3. 200 SMA

Trading range is expected within this confluence region.

Sunday, May 30, 2010

Genting Betting on 200 SMA Resistance Band


The bulls lost 3 times in the past as indicated by the red down arrows when they played against the 200 SMA resistance band. Another bull attack is imminent on this bear fortification. Victory here will advance the bull march towards the triple bear resistance defence lines from 1.10 to 1.18 and challenge the 1.20 milestone.

If history is repeated and the 200 SMA band continues to stand then a fall towards 95 will be inevitable. Further weakness will test the 91 to 88 support zone. Major base support is at 85 to 83 and support failure here may see a drop towards 80 and 75 support zone.

Friday, May 28, 2010

DJIA Must Clear and Stay Above 200 Moving Averages To Sustain Rally


The candlestick reversal pair consisting if a hammer followed by an inverted hammer has been confirmed by a bullish marubozu candlestick bar. This rally can only be sustained if the DJIA breaks above and remain above the 200EMA and 200SMA. High chance of challenging the green resistance of the potential diamond pattern if this rally is maintained.

Stay alert and monitor the critical red support of this potential diamond formation. Support failure here will confirm the bearish diamond top and will probably result in a long term bear market.

Thursday, May 27, 2010

Yangzijiang Positive MACD Histogram Divergence


Potential breakout above the 1.28 to 1.30 immediate resistance zone is imminent according to the positive MACD histogram divergence pattern. Upside surge will probably move within the green channel and head towards the next resistance zone at 1.35 to 1.36 followed by a challenge of the dashed orange mid channel trendline.

Conversely, should there be any shocking news the breakdown below the 1.20 immediate support will retest the lower support of the blue channel. Support failure here will probably result in a downward fall toward the 1.13 to 1.12 support zone.

Wednesday, May 26, 2010

DJIA Potential Hammer Reversal Candlestick Pattern


The potential diamond top formation was not confirmed as DJIA closed above the critical red bold support line. A potential hammer reversal candlestick has formed and this may mark the beginning of a new uptrend. A similiar hammer was formed on 5 Feb 2010 as indicated by the light green arrow.

This new potential hammer needs to be confirm with a bullish candlestick bar. It needs to clear both the 200 moving averages to regain its bull status. A breakout above the 200 moving averages will probably challenge the green resistance of the potential diamond pattern.

Tuesday, May 25, 2010

Metastock Turtle Trader Hybrid Exploration as at 25 May 2010


As expected all shorts with only 2 longs not on the this list because their traded volume were too low. This is only the first page of a 5 page Metastock exploration result using the famous turtle trading system developed by Richard Dennis. This system is available as part of the Metastock 11 charting software. Free trial available at www.metastock.com/tacttrial

DJIA Flaccid Unable To Clear 200EMA


High chance of diamond top confirmation if the close is below the red bold support of the potential diamond pattern. A low near the 127.2% Fibonacci level will not shock me personally. A move below this level will be interesting and exciting. More important is the closing. Above or below the red bold support of the potential diamond pattern. Take note of the amplitude of any technical rebound as it will provide clues of market directions for the next few days.

The optimist sees opportunity in every danger; the pessimist sees danger in every opportunity. Happy charting and profitable trading.

Z-obee Confirms Inverted Cup and Handle Formation


Kudos to those who heeded the warning posted on 21 May 2010. Congratulations to the seasoned and braveheart traders that shorted. Next support is probably 36 followed by measured move target of 34. Immediate short term resistance is 38.

Stocks Near the Bulls and Bears Border


As the market continues to move down more stocks are testing the 200SMA bulls and bears boundary. Posted above is part of the Metastock exploration result indicating potential bearish stocks sorted by top volume. Potential shorts for those who have CFD trading accounts. Seasoned and braveheart traders may try short term technical rebound trades.

Monday, May 24, 2010

Yangzijiang Early Advance Reverses At Close


Just like a double edged sword the blue dashed dual trendlines cuts in both directions. Above this dual trendlines it acts as support but once price falls below it the other edge acts as a resistance. Early bulls who did not take profits were slaughtered by this sword as the market closed below the opening price and now sits at the light green immediate support band.

Besides the blue dual trendline resistance acting as a butchering knife other resistances include

1. Ichimoku Kumo

2. 20 SMA

3. Pink resistance zone

4. Dark green resistance belt

Take note that support failure of the light green band will see this Yangzijiang ship heading for rough seas and will challenge the following supports

1. Orange zone

2. Light blue support area

3. 200 EMA

4. $1 mark

Wilmar Key Support and Resistance Levels


Currently trading in a range between the green immediate resistance band and the lavender immediate support band. Any upward surge will need to breakout above the major pink resistance zone followed by the filling of the huge gap before meeting the light blue gap resistance belt.

This new bear counter must now redeem itself by challenging both the 200SMA and 200EMA. The ability of rejoin the bulls maybe short live if the Ichimoku Kumo bear grip blocks further upward move.

Take note that any weakness will result in a breakdown below the lavender immediate support band and retest the orange support band. Support failure here will probably trigger a bear raid towards the $5 milestone.

Friday, May 21, 2010

Genting Hammer Variant Testing Neckline Channel


The powerful Ichimuko Kumo bear grip has forced price to fall from the top of the cloud until the bottom of this storm kumo.Once again the neckline channel of the complex head and shoulders pattern is being tested. Immediate resistance at 93 must be overcome to advance to the 95 milestone. Major resistance is the green former support turned resistance zone.

If weakness returns then a drop into the red neckline channel will be inevitable followed by a test of orange support band. Major support is the lavender support base.

Yanlord Falling Towards Major Support


Doji candlestick has broken the lower red channel immediate support. Orange bull support zone preparing for high probability bear attack. Support failure here will move bull defences to the lower supports of the blue, lavender and green channels.
Stay alert as bears continue their downward march.

DJIA Closed Below Critical 200 Moving Averages


DJIA closed below both the 200SMA and 200EMA. Since July 2009, bulls have been using these critical moving averages as support guides and this weak closing signals potential further bearish falls. A breakdown below the red dotted trendline will retest the red bold support of the potential diamond top formation.

Take note that any technical rebound may meeting resistances at 200SMA and 200EMA. Any unexpected upward surge will probably be halted at the green resistance of the potential diamond pattern.

Z-obee Potential Inverted Cup and Handle Formation


Immediate support at 44 is critical trigger that will confirm the bearish cup and handle pattern. A breakdown below this major support will probably result in an initial drop to the 40 support level. Further weakness will fulfill a measured move projection as indicated by the red arrows and will see a test of 34 support. Stay alert and be nimble as market continues its wild volatility swings.

Wednesday, May 19, 2010

200 Weeks Simple Moving Average 2% Band List


Metastock exploration for SGX stocks near the 200SMA weekly support and resistance band. A move above this band means more upside is expected for potential long trades. However, a breakdown below this band will probably see more declines and be potential shorts.

Genting Betting on 200 Moving Averages


Bears are using the red 200SMA resistance as a defensive barrier to keep the Bulls from advancing further up. A breakout above this resistance will probably propel price upwards within the blue channel.

Bulls have established support at the blue 200EMA. A breakdown here will probably see a drop and downward slide within the red channel.

Time is running out for contra and margin players. Stay alert and be nimble as show hand time approaches.

Monday, May 17, 2010

Noble Testing Major Support Zone


Major support zone is being tested. This support zone consists of

1. 200SMA

2. Red dual support channel

3. Lavender support band

4. 200EMA

Support failure here will result in a retest of the green support band and if further weakness persists a downward slide within the blue channel is expected.

Take note that any rebound from this major support confluence zone will need to clear the upper resistance of the blue channel and strong resistances are imminent at the orange resistance belt and the Ichimoku Kumo Resistance Cloud.

Sinotel Weekly Chart Channel Testing


Green channel support will be tested and support failure here will see a drop into the orange confluence support box region. A successful rebound from the lower green channel support will meet strong resistance at the 45 milestone. Upward moves will probably be restricted by the upper resistance of the blue, green and red channels.

Stay alert and be nimble as current market condition continues to exert downward pressure.

Friday, May 14, 2010

Genting Ichimoku Kumo Resistance Testing in Progress


The breakout above the green band has confirmed the double bottom pattern formed at the lavender base support zone. A measured move projection calculation has established the dark orange band as the target price of this double bottom breakout. This can only be achieve if price can overcome the bear grip of the Ichimoku Kumo Resistance followed by the dual resistance lines of the red channel and the dark blue resistance zone.

Take note that if the major support formed by the green band and the 100EMA fails a retest of the beige, light blue and lavender support is imminent.

Thursday, May 13, 2010

Noble Testing Triple Resistance


Blue 200SMA and lower green channel support rebound currently facing triple resistances


1. Upper red channel resistance
2. Upper green channel resistance
3. Lower boundary of Ichimoku Kumo


A successful breakout above these resistances will probably meet further resistances at the upper boundary of the Ichimoku Kumo followed by the 3.30 gap resistance.


Take note that failure to clear the current triple resistances may result in a pullback towards the 200SMA and the lower green channel support. If weakness persists then there is a high chance that price will trade within the downward red channel.

Wednesday, May 12, 2010

Metastock Turtle Trader Hybrid Exploration as at 12 May 2010


Turtle Trader (Hybrid) System is one of the 5 NEW Name Brand Systems that is part of Metastock 11 End of Day Version. Turtle Trader (Hybrid) System is based on the well-known and widely published Turtle System, this system generates buy signals when the price moves above the highest high of the last 20 days. Short signals are generated when the price moves below the lowest low of the last 20 days. Positions are closed when prices reach the extremes of the previous 10 days.

This system could easily sell as a separate MetaStock Plug-In but it is now free as part of MetaStock 11. Free trial of Metastock 11 is now available at www.metastock.com/tacttrial.

Yanlord Potential Inverted Cup and Handle Formation


The giant dome structure has transformed into a potential giant inverted cup and handle formation. A breakdown below the blue support zone confirms this bearish pattern and will probably result in a fall towards the orange dotted support line. Further weakness may see a retest of the green dotted support band.

Take note that there may be formation of multiple handles if bullish buying support defends the blue major support zone of this potential inverted cup and handle pattern.

Monday, May 10, 2010

Genting Betting on Major Resistance Zone


22 Feb 2010
1st attempt to clear green major resistance zone

16 Mar 2010 to 22 Mar 2010
2nd attempt with multiple daily bars within the green band

30 Apr 2010
3rd attempt with shooting star candlestick warning of bearish pullback and the additional resistances from 100EMA and the upper red channel resistance

10 May 2010
Testing of triple resistances formed by green resistance band, upper red channel boundary and 100EMA in progress. A strong breakout above this major green resistance barrier will challenge the pink resistance band. If strong follow up buying continues the dark blue resistance barrier may be tested.

However if the bears wins the bet expect a retracement to the following probable supports

1. Pale orange belt

2. Lower red channel support

3. Light blue band

4. Critical lavender base support

Sunday, May 9, 2010

DJIA Potential Diamond Top or Diamond Continuation Pattern ?


Expect more wild wide swings between the green and red lines of the potential diamond formation. A breakout above the green resistance line must clear the top apex of the diamond to confirm that it is a continuation pattern and this will see more upward climb of the DJIA.

However if the DJIA is unable to propel above the red 100SMA resistance and the orange dotted horizontal resistance it will probably retest the green 200SMA support followed by the light blue dotted horizontal support and the red support line of the diamond formation. Support failure here will confirm the diamond top and more downward pressure will be imminent.

Search 2.0